
McQuilling Renewables LLC, a subsidiary of McQuilling Services LLC, was contracted in 2023 by the New York State Energy Research and Development Authority (NYSERDA) to assess marine uses beyond the 60-meter depth contour in waters off New York State in support of offshore wind site planning. The study, titled “Offshore Wind Planning in the New York Bight: Maritime Assessment–Commercial and Recreational Uses Study” was published in February, 2025 and is now available for download.
Click here to download the full PDF report (preview below)
Summary
This Maritime Assessment–Commercial and Recreational Uses Study considers marine activity for
offshore wind (OSW) lease areas beyond the 60-meter depth contour. It provides an updated perspective
on the maritime uses in the relevant offshore region addressing maritime commercial, recreational, and
other marine activity in waters 60 meters and deeper, based on both historical data as well as projected
activity into the future. The development of this study followed several guiding principles:
- Given the body of previous work conducted for New York State Energy Research and
Development Authority (NYSERDA) Master Plan, and subsequent studies and the efforts on
the State and national scale to make planning information available, leverage previous work. - Use actual data in analysis and evaluation for developing observations, findings, conclusions,
and recommendations. - Use marine operation and navigation safety considerations to inform realistic operational
parameters for commercial traffic and for recreational use. - In and around this Area of Analysis (AoA), all marine uses originate from vessels, and
understanding marine traffic is a key to understanding marine uses in this region. - Planning processes for offshore wind are a collaborative, multidisciplinary effort, the result of
which will ultimately involve a large heterogenous population of stakeholders, and it is
important that the project employ a process to acquire, evaluate and incorporate stakeholder
feedback.
The AoA for this study is an irregular rectangular polygon encompassing approximately 35,670 square
miles south and southeast of Long Island. It is divided into three zones from north to south beginning
at the 60-meter (approximately 200-foot) depth contour and extending southerly out to the 3,000-meter
(9,840-foot) depth contour (New York State Marine Technical Working Group [M-TWG] 2023a;
M-TWG 2023b). For this study, a regular rectangular polygon was defined that bounds the AoA and
the adjacent region of interest around the AoA with regard to marine uses, specifically the acquisition
of vessel position data during the 2017–2022 period (Figure S-1).
Figure S-1. Region of Interest and Area of Analysis
Source: NYSERDA, McQuilling Renewables

S.1 Characteristics of Marine Use and Traffic
In this region, all commercial and recreational marine uses originate from vessels, which
informs the classification of uses and the associated marine traffic. Cruise ship tourism, whale
watching, charter/for-hire fishing and underwater activities are all considered commercial uses driving
commercial marine traffic. To provide a framework to qualitatively understand the influence of marine
traffic, identifying use characteristics is a worthwhile effort. When considering regional influence,
characteristics such as persistence, density, navigational flexibility, maneuverability, economic
effect, regulatory oversight, and purpose are useful descriptors. While uses with the extremes of each
characteristic are easily grouped into commercial and recreational categories, each marine use will have
different assessments of these characteristics, but in general, can be associated with either a commercial
or recreational activity for the purposes of this study (Table S-1).
Table S-1. Marine Use and Traffic Characteristics and Intensity
Source: McQuilling Renewables
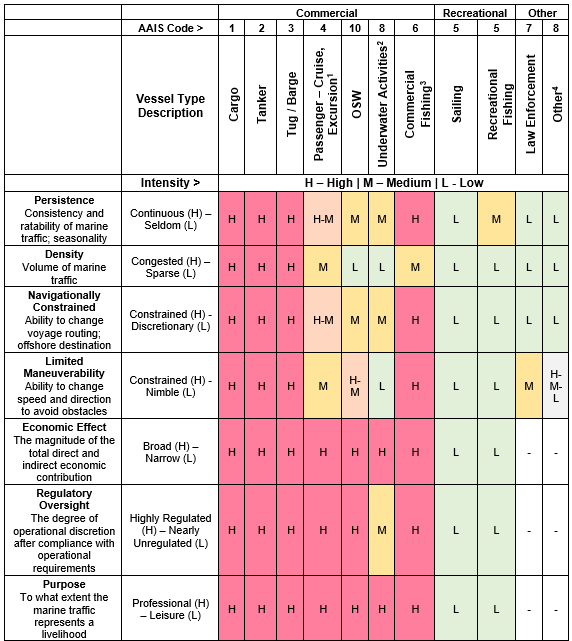
a Passenger type vessels include large cruise ships, ferries, and excursions vessels.
b Underwater activities include wreck and reef diving.
c Commercial fishing vessels include charter/for-hire fishing boats in this study.
d Other includes: Wing-in-ground (WIG), high speed craft (HSC), dredging, diving, pilot, search
and rescue (SAR), port tender, oil recovery, research vessel, and school ship.
Commercial fishing, charter/for-hire fishing, and recreational fishing are commercial and recreational
uses in and around the AoA. This study provides historical marine traffic resulting from these uses
as available from Automatic Identification System (AIS) remotely sensed vessel position data, along
with qualitative discussion of these uses. Other NYSERDA studies, such as the Fish and Fisheries
Data Aggregation Study (NYSERDA, 2025), provide in-depth analyses of these uses, and reports
should be reviewed collectively for full analysis of relevant deepwater uses.
S.2 Presence and Persistence of Uses and Marine Traffic
To evaluate marine uses in and around the AoA, remotely sensed vessel position data was analyzed
for the years 2016 through 2022. AIS data was selected from several electronic data alternatives and
obtained from MarineCadastre.gov. This data is well-structured, readily available, and through the use
of geographic information system (GIS) tools and relational databases, provides a trove of logistics
intelligence about the presence and persistence of vessels in and around the AoA. AIS position data
analysis was supplemented with qualitative information and research from numerous sources further
characterizing marine uses and traffic.
Most commercial marine traffic consists of vessels carrying cargo or passengers transiting from port
to port. The exceptions are commercial fishing and activities such as wildlife viewing (whale watching)
or undersea activities (diving) that are destinational, traveling from ports ashore to destinations offshore
and back. Commercial marine traffic associated with OSW development is also destinational. Figure S-2
illustrates the density of commercial marine transiting traffic spatially for the region of interest in this
study. Cargo vessels and tankers make up 95% of the presence of commercial transiting vessels in the
AoA (2017–2022 average).
Commercial marine transiting traffic is concentrated in several transport corridors or fairways, as visible
in Figure S-2. These represent the areas of most traffic density in the region. The balance of the region
sees vessel traffic during the year, but it is spread out spatially and far less frequently. Based on traffic
patterns, the United States Coast Guard (USCG) establishes traffic separation schemes (TSS) and safety
fairways with input from stakeholders and collaboration with the International Maritime Organization
(IMO) and other agencies to inform on navigational safety in the region. A substantial knowledge and
experience base exists domestically in the U.S. from over half a century of offshore oil and gas industry
experience navigating near fixed offshore structures in the U.S. Gulf to inform this activity. This is
supplemented by a growing body of international experience operating vessels in and around wind fields.
Figure S-2. Commercial Vessels Transiting Carrying Cargo or Passengers (2022)
AAIS Codes 1-Cargo, 2-Tankers, 3-Tug/Barge, 4-Passenger—Vessels that transit the region
carrying cargo or passengers from port to port.
Source: Marine Cadastre

Following an economic slowdown into 2018, commercial marine traffic in and around the AoA
has been on an upward trend through the 2018 to 2022 period. Econometric modeling conducted
for this study suggests forecasted non-OSW growth through 2050 is positive overall with underlying
cargo transport demand across shipping sectors ranging between 1.71% and minus 1.44%, averaging
0.64% per annum. Traffic patterns are expected to remain consistent with the past based on analysis
of vessel positions in the region from 2017 to 2022.
Figure S-3. Major Offshore Wind Marine Traffic (2024–2050)
Source: McQuilling Renewables
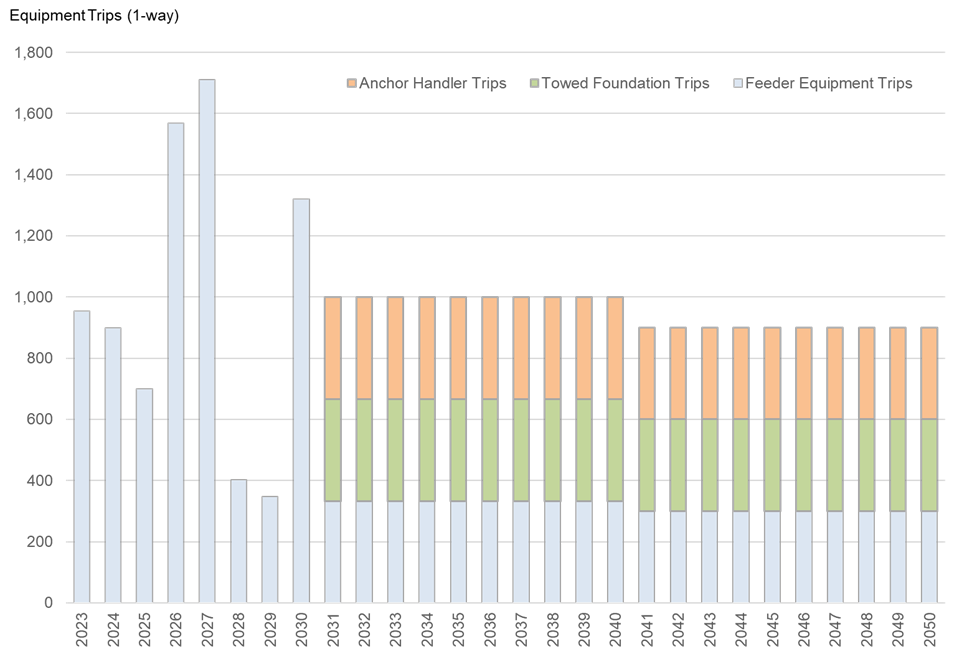
OSW-related marine traffic will grow as OSW projects are developed and installed. The most relevant
activity will come from larger vessels and marine equipment engaged in the transport and installation
of foundations and turbine components (towers, nacelles, blades). Figure S-3 displays an estimate of
marine equipment trips developed in this Study in and around the AoA on an annual basis to 2050,
based on offshore-energy-capacity forecasts, equipment specification forecasts, assumptions of transport
logistics, and installation processes. Estimates of OSW marine traffic in future years are based on many
assumptions and as a result imprecise; nonetheless, they are useful for comparative purposes. At almost
1,000 trips annually, the transport demand is material, but spread out spatially across the region.
Figure S-4. Remotely Sensed Recreational (Non-Sailing) (2022)
AIS Code 37—Pleasure Craft (Non-Sailing)
Source: Marine Cadastre

Recreational marine traffic consists of sailing, recreational fishing, and transits to or through the region.
In Figure S-4, the intensity of activity for non-sailing recreational vessels can be seen primarily in Long
Island Sound and along the southern Long Island coast and New Jersey coast. Notable exceptions are the
density lines showing frequently transited corridors from ports on the southern shore of Long Island and
New Jersey to positions along the rim of the continental shelf, where Zone 2 of the AoA begins. These
are highly likely recreational fishermen, an observation corroborated by inspection of commercial
fishing density contained in this study.
Figure S-5. Availability of the Region for Recreational Boating throughout the Year
by Month (2000–2022)
Availability at Buoy 44008, Basis Sea State
Source: McQuilling Renewables

Most recreational vessels, according to USCG boating statistics, are small craft, which can be considered
vessels under 65 feet, and weather and sea state conditions limit availability of the AoA to these vessels,
as shown in Figure S-5, limiting their presence and persistence in the region. For these vessels, the
region’s availability may be reduced to as little 30% during winter months and even during summer
months, is likely unavailable 15% of the season. (USCG Office of Auxiliary and Boating Safety 2021).
State boater registration data reveals over half of recreational boats in the region typically do not go
out on water on an annual basis. When they do, the average outings are relatively short (3 to 5 hours)
and not far from shore (3 nautical miles [nm]). These discretionary use statistics further reduce the
expected presence and persistence of recreational boats in and around the AoA (Duffy, et al. 2020).
S.3 Recommendations for Further Work
- The availability of long-series data sets of remotely sensed vessel position data compels
further analysis of this information in the region. There are acknowledged limitations to the
data in terms of inaccuracies and completeness, but these data sets represent large repositories
of actual observations and could be more deeply mined for marine logistics intelligence.
Acquiring commercial satellite AIS data would help solve issues of completeness and
technology can be employed to address inaccuracies. - Vineyard Wind 1 marine logistics data is another source of actual observations of what
marine equipment is required to construct a wind field project. Collection of marine logistics
data should continue through installation of turbine components and into other operations
and maintenance stages. This information will provide robust parameters for use in estimating
future OSW field development. - The recreational boating statistics used in this study are from one of few sources of recreational
boating information. Additional surveying of this community that segments recreational traffic
into logical use cases is suggested to provide more specific intelligence on how different
segments of the community use the region. - Relatively simple economic modeling was carried out in this study to project marine traffic
growth through 2050. More sophisticated econometric models may be employed for a more
rigorous treatment of marine traffic growth forecasting
