
By: Blue Ocean Transfers Group, LLC
Rutgers University, Department of Industrial & Systems Engineering
and
Incat Crowther
Executive Summary
The application of alternative energy sources to power high speed aluminum fast support vessels (FSVs) on offshore routes is the subject of this study. FSVs are widely used in many offshore logistics applications to transport and transfer technicians, their gear, equipment and materials from shore facilities to offshore sites as part of installation, construction, operations and maintenance work scopes. Offshore infrastructure and locations including energy exploration and production, fishery facilities, aquaculture, research and survey are supported by these versatile craft. An investigation of alternative energy sources to power these vessels explores more cost effective and optimized provision of marine transport services.
One of the primary objectives of this work was to realistically identify energy requirements resulting from US offshore deployments in actual sea states observed understanding that for a given vessel, wave height is the principal factor in resistance and therefore power requirements. In this study we developed a probabilistic environmental conditions model to demonstrate statistically significant differences in energy consumptions for FSVs considering offshore deployments in sea spectra as compared to calm water energy use.
The focus of the work described in the study is on electricity as an alternative energy source for propulsion. Dynamic sea states provide better information to inform on the design of electrified vessel systems, especially with regard to energy storage equipment. We developed a simulation model for FSVs deployed on offshore mission profiles in dynamic sea states, across five different US offshore regions and for four increasingly electrified propulsion platforms from Tier 3 diesel to fully electric configuration. The results of the simulations helped to identify the types of deployments favoring electrification and quantify this effect for the different deployments and propulsion platforms.
Finally, we investigated an effective implementation of FSV electrification assuming use of the same vessel platform where installation of successive configurations – starting with an initial diesel propulsion system then hybrid electric systems – led to a fully electric vessel. We then examined the economic attractiveness of this approach which suggested favorable investment. We looked at the sensitivity of the results to a number of economic parameters as well as the notion of the social cost of CO2 emissions.
This brief has attempted to introduce a quantitative approach to the consideration of electrification of FSVs. As such we hope to advance the perspective forward from “hybrid ready” thinking to a realistic pathway forward towards electrification in concert with advancing technology.
Realistic Environmental Conditions Model
An empirical/numerical statistical modeling approach created in the study produces realistic met-ocean datasets which are trained to given regions identified by the proximity of the buoys employed for data collection. This approach is generalized to apply to coastwise US regions and also internationally, with numerical models trained by regional buoy data.
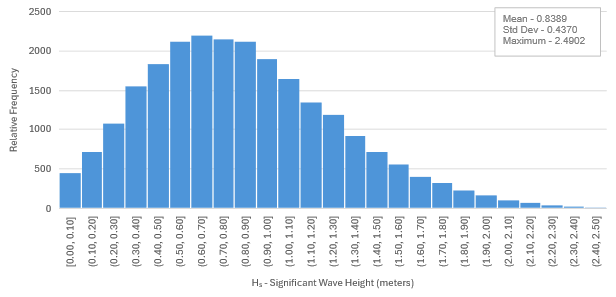
Figure ES-1 – Significant Wave Height Distribution – Mid-Atlantic Region (MAR) – Full Year
Source: Rutgers University
Figure ES-1 displays a frequency diagram of significant wave heights (Hs) for the Mid-Atlantic Region (MAR) off the US east coast, produced by the environmental conditions model in this study. In this region the mean Hs is 0.84 meters, with the preponderance of wave heights to the lower side of the distribution, indicating a relatively benign historical sea state.
Sea States
There are significant differences in sea spectra across regions with sea states varying from benign to severe – the models produced in this study allow for quantitative analysis of their comparative impact on the type and design of vessels deployed. In Figure ES-2, a cumulative density function (CDF) compares the behavior of sea states across several regions. This figure illustrates the relatively severe sea states experienced over time off the US west coast (purple line) with higher Hs values predominating as compared to the other plots, with the US Gulf indicating the most benign conditions offshore (yellow line).
Figure ES-2 – Empirical Cumulative Density Function (CDF) of Significant Wave Height (Hs)

Source: Rutgers University
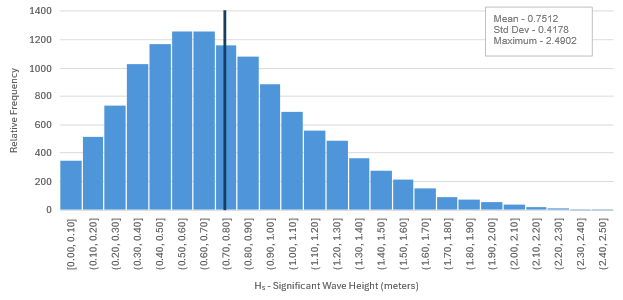
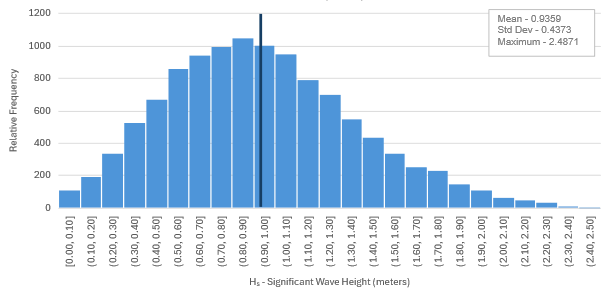
Seasonal variation of sea states exhibits the same behavior across all regions: winter conditions are more severe in general than summer conditions. In Figures ES-3 and ES-4 the summer and winter seasonal results are shown for the MAR. Note that Hs is 0.75 meters in the summer and 0.93 meters in the winter. In the figures the bars represent the number of simulations with results for Hs in the ranges indicated.
Figure ES-3 – Total Diesel Consumption Distribution – MAR Summer Season
Source: Rutgers University
Figure ES-4 – Total Diesel Consumption Distribution – MAR Winter Season
Source: Rutgers University
Simulation Model Results
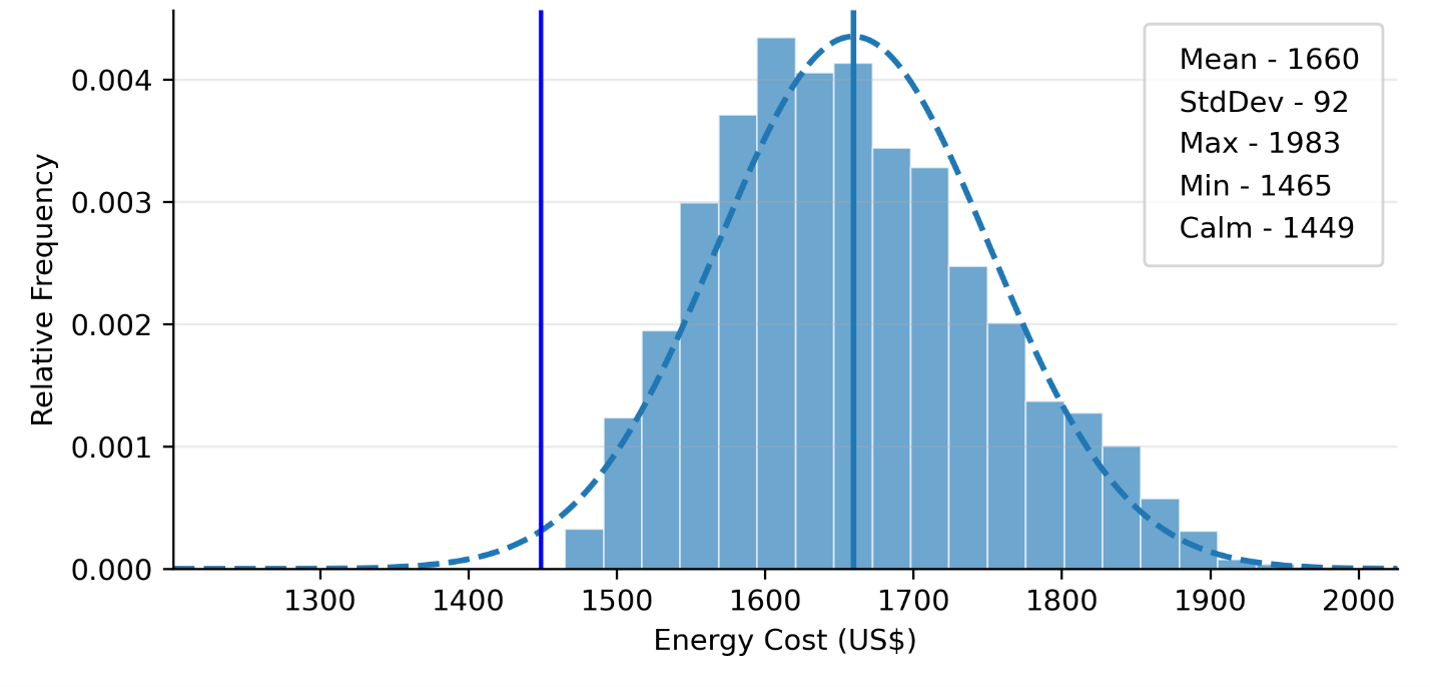
The simulation model developed in the study produced energy consumption and emissions distributions and then total energy cost distributions for deployments in dynamic sea states that were useful as input parameters to the design process for FSV propulsion. In the figure the bars represent the number of simulation runs with results for total energy cost in the ranges indicated.
Figure ES-5 – Total Diesel Consumption distribution – MAR (Full Year Season)
Source: Rutgers University
In Figure ES-5 the energy consumption for a diesel propulsion driven FSV is a distribution resulting from operating in dynamic sea states during the course of its mission. The mean energy consumption is US$ 1,660 for each round trip in the MAR. In the figure the calm water energy consumption is shown as the vertical blue line – a value of US$ 1,449. The difference between the statistical conditions model mean and the calm water result is statistically significant – meaning that the distribution generated by the conditions model represents a more realistic estimation of actual consumptions on the voyage.
A New Parameter: Serviceability
Accessibility and approachability, measurements used to determine the likelihood of completion of a vessel’s mission, are limited to spatial and temporal factors at one specific location and are therefore insufficient to characterize regional deployments to offshore sites. A new measure – serviceability – considers sea state conditions that the vessel will experience along its entire route, not just at a specific location or time.
Figure ES-6 – Multivariate (Wind and Wave) – Mid-Atlantic Region Full-Year Serviceability vs. Accessibility
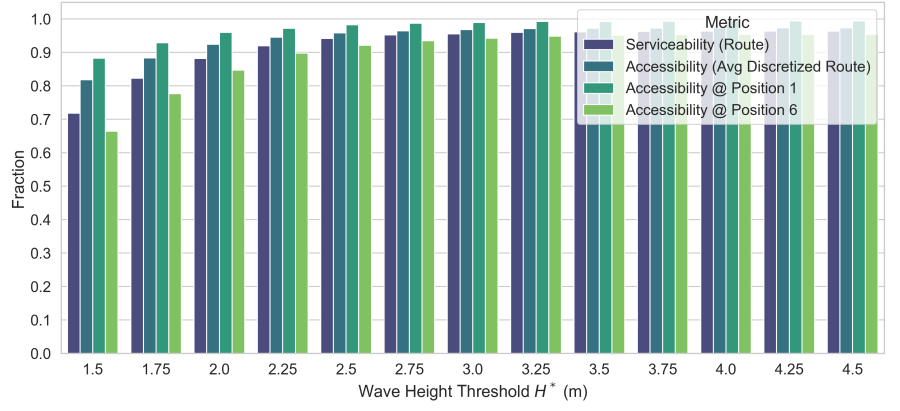
Source: Rutgers University
Serviceability is most closely related to accessibility at the offshore site, reflecting the prolonged time the vessel spends at the offshore site in harsh met-ocean conditions. However, a vessel operator would have a less accurate projection if focusing solely on accessibility at the site since it represents a lower likelihood of mission completion. Therefore, serviceability, which encompasses environmental factors during the entire mission, is a more useful tool for strategic planning of construction and operations & maintenance (O&M) phases of offshore sites. Note that in the case of failed missions when the vessel has gone out but was forced to return to shore because of unexpected harsh conditions, the energy consumption and resulting emissions must also be accounted for.
Electrification
As the level of propulsion platform electrification increases, the total energy cost and total emissions declines. Figure ES-7 illustrates the total energy cost for four different propulsion platforms, from right to left: fully diesel, hybrid, advanced hybrid and fully electric propulsion. The frequency diagrams include estimates of diesel fuel cost and electricity cost per simulation run for each propulsion platform. The dashed line plots are normal curve distributions confirming the central tendency of the distribution around mean values. Energy cost distributions for each of the platforms show the decreasing total energy cost as the propulsion platforms become increasingly electrified.
Figure ES-7 – MAR Total Energy Cost by Propulsion Type (Full Year Sea State)
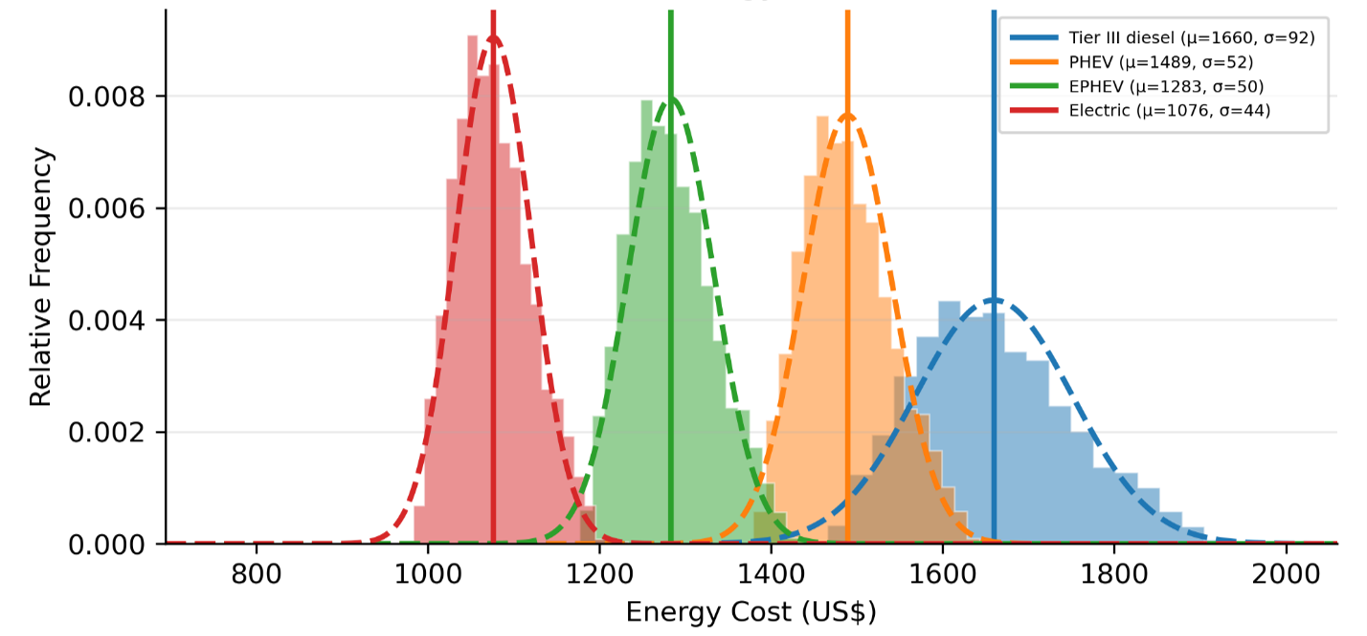
Source: Rutgers University
The same behavior is seen for CO2 emissions – as the propulsion platform moves to greater levels of electrification, the emissions reduce correspondingly. Note that no emission distribution is shown in Figure ES-8 for the fully electric platform.
Figure ES-8 – MAR Total Emissions by Propulsion Type (Full Year Sea State)
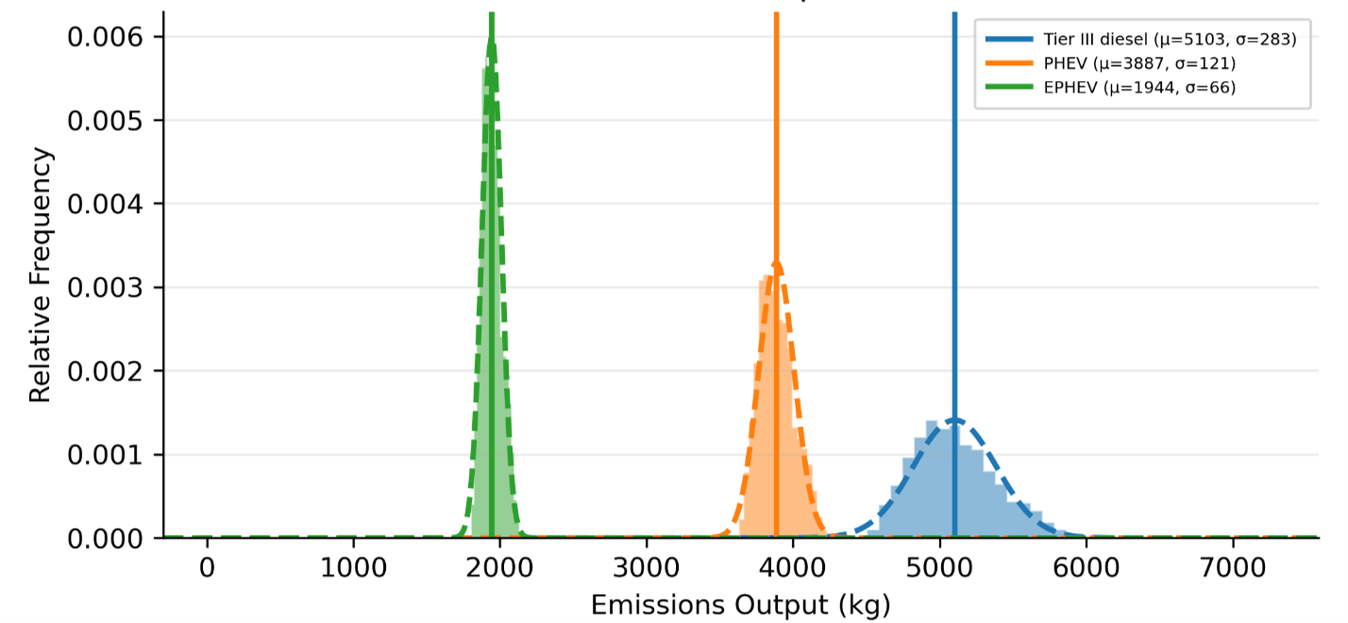
Source: Rutgers University
Deployment Criteria
Figure ES-9 – GULF Total Energy Cost by Propulsion Type (Full Year Sea State)
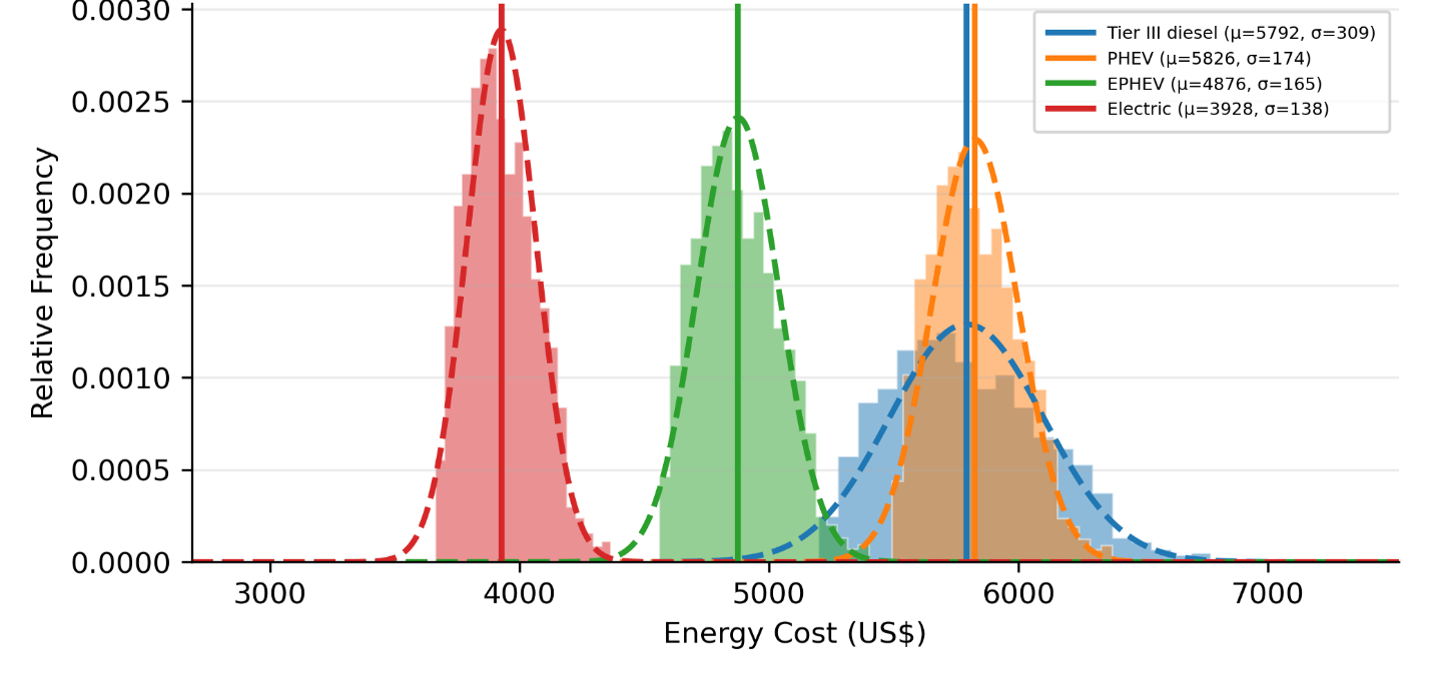
Source: Rutgers University
Regional deployments with high speed transits representing large portions of the operational profile are not ideal candidates for electrification. Figure ES-9 illustrates the total energy cost for a simple hybrid electric propulsion configuration (orange distribution) is about the same as for a fully diesel driven platform (blue distribution) on a US Gulf support deployment for an oil rig. This is because the majority of this voyage is conducted at high speed where the diesel engines provide 100% of the energy. In this case, there is very little benefit from hybridization.
This finding provides quantitative information for marine logistics providers regarding when electrification is favored – and justified – for offshore vessel deployments. In some cases, especially those voyages with high energy-intensity, high speed legs of long duration, electrification would not be indicated. While the red distribution in Figure ES-9 illustrates theoretical energy consumption for an all-electric propulsion platform, the energy storage density (ESD) required to achieve this is not currently commercially available and may not be well into the future, beyond the timescales discussed in this study (10 years).
Roadmap to Full Electrification of FSVs
Current industry experience provides an assessment as to where electrification is most applicable today. Recent newbuilding projects and current orders signal shorter voyage distances, lower speeds, access to fast charging and limited payloads as criteria favorable to electrification of marine transport solutions. Mission requirements for passenger and car ferries, excursion boats for day trips, short sea cargo carrying deployments and other cases can be effectively addressed by vessels with increasingly electrified propulsion platforms. As ESD improves (as it has been improving, exponentially), more marine applications will qualify for this energy source going forward.
In this study, two regional deployments were determined to be unfavorable candidates for electrification at current technology levels (for ESD), due primarily to long transit legs at high speed relative to the total duration of the voyages. The US Gulf deployment (GULF), while in relatively benign sea states, was composed almost entirely of a full speed (25 knots) run out to the site 108 nautical miles from shore. The second deployment was off the US west coast (USWC) where the voyage was shorter (48 nautical miles one-way), but still the majority of the voyage duration is accomplished at high speed. In these cases, current ESD technology cannot support the energy requirements nor is it anticipated in the foreseeable future.
Nonetheless, there are deployments for FSVs that are good candidates for electrification. The remaining three deployments off the US east coast (Northeast Corridor – NECL; New York Bight – NYB; and Mid-Atlantic Region – MAR) all represent feasible routes for deployment of electrified FSVs. The challenge is to increasingly electrify the propulsion platform of the FSV in concert with the ESD technology level existing at the time to do so. Current energy storage density (ESD) technology does not presently support feasible offshore deployments of fully electrified high speed aluminum catamaran service vessels. However, a fully electric FSV is feasible within a 10-year timeframe for selected offshore deployments with required onshore and offshore charging infrastructure, based on projections of ESD improvements over time.
Figure ES-10 – BOT Estimation of Commercially Available ESD in 2035
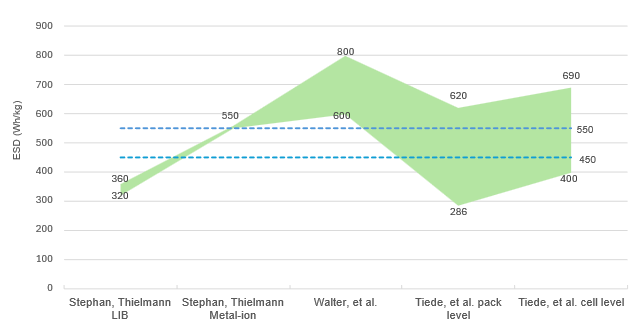
Source: BOT
Phased Electrification
Rather than wait, electrification can be pursued in phases beginning with initial construction of a diesel driven FSV or a parallel hybrid propulsion platform (PHEV), then progressing to an enhanced parallel hybrid (EPHEV) and finally to a fully electric configuration.
Figure ES-10 – Phased Electrification Approach
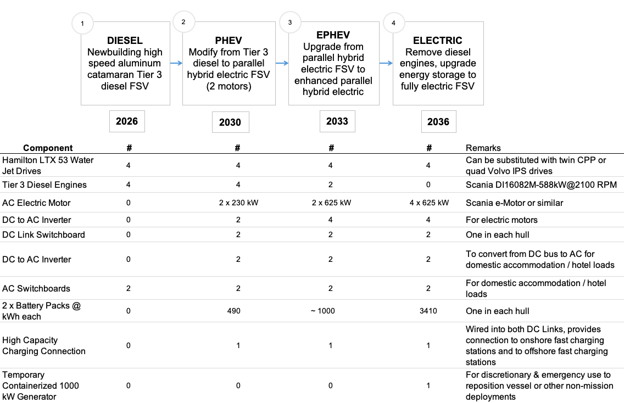
Source: BOT
Electrification Value Proposition
To cost effectively evolve from Tier 3 diesel propulsion to full electric, we assumed use of the same vessel platform and future-proofed the design by working backwards from a fully electric configuration in 10 years’ time. We then examined the economic attractiveness of this approach which yielded favorable investment signals when considered as a series of initial capital investments followed by a stream of positive cash flows from reduced energy costs inside a discounted cash flow framework. Sensitivity to investment levels, energy pricing and the social cost of CO2 emissions were evaluated. Lower capital costs, achieved through subsidy or technology improvement produced outsized incremental returns. Results were very sensitive to the pricing spread between the cost of diesel fuel and electricity. Finally, surprisingly low social costs of CO2 emissions, when factored into the cost/benefit analysis, produce significant investment returns.
There is an attractive value proposition when considering full electrification achieved in stages over a 10-year timeline even without consideration of the social cost of emissions. Figure ES-11 illustrates the range of internal rates of return on an unlevered investment in electrification for an FSV on three US east coast offshore deployments. Base case assumptions produce a 5-12% return on investment and sensitivity analysis yields returns in excess of 18%. Relatively low social costs of emissions can produce 20% returns on capital employed.
Figure ES-11 – IRR Range with Capital Cost and Energy Cost Variation
(20%) Capital Cost Variation, +/- 10% Energy Cost Variation
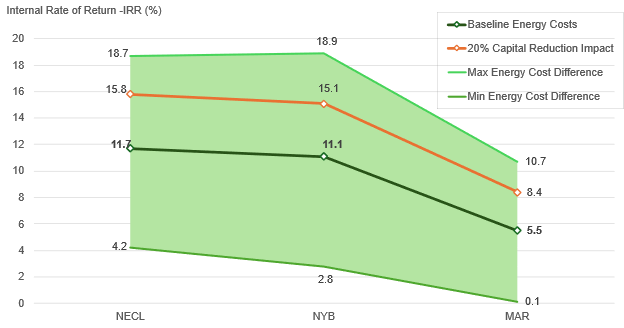
Source: BOT
Table ES-1 – Discounted Cash Flow Analysis Results NECL-NYB-MAR – Solving for Social Cost of Emissions
| US$ Million | NECL | NYB | MAR |
| Cash Flow Valuation – All Equity | |||
| Capital Invested (PHEV, EPHEV, Electric) | 5.0 | 5.0 | 5.0 |
| PV of Capital Invested | 2.7 | 2.7 | 1.7 |
| Total Present Value Energy Savings | 3.0 | 2.9 | 1.9 |
| IRR | 20% | 20% | 20% |
| Total Social Cost of Emissions Required for 20% IRR | US$ 62.73/mt | US$ 61.40/mt | US$ 155.20/mt |
Source: BOT
Future Work
The subject matter addressed in this study is broad: Environmental conditions modelling; spatio-temporal vessel deployment modeling and simulation; technical feasibility of FSV propulsion system electrification including a survey of current industry experience and projection of energy storage density levels into future; and financial analysis of vessel design alternatives. Each of these areas represents opportunities for further work to extend the thinking around what is possible for marine equipment electrification now and in the near future.
Further work addressing the incorporation of additional sea state and weather variables into the environmental conditions modeling is an area with substantial scope. The addition of wave direction, wave period and current may increase model utility in describing the total impact of environmental conditions on vessel performance and requirements.
Three regions and five locations were evaluated in this study, all offshore the continental United States. A worthwhile endeavor would be to expand the analysis to include offshore Alaska and the Great Lakes, as well as selected international regions/locations.
Key variables of energy consumption and emissions production were estimated using the Delphi approach. There are large reservoirs of empirical data housed in private companies related to vessel speed and performance in sea states. Use of this data to develop parametric estimations of consumption and emissions would likely produce more realistic results. It would also aid in the incorporation of additional variables into the environmental conditions model such as wave direction since the direction required is actually a relative direction of the wave heading versus the vessel heading.
Serviceability is a new measure developed as a result of this study – there is a broad scope of work in furthering attention on the serviceability parameter and its use in logistics planning, site evaluation, vessel spread analysis, and operational deployment planning and scheduling.
